Latest Images
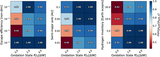
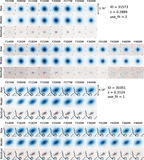
Sensitivity of the reflation mechanism on mantl...
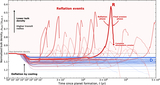
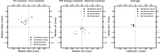
Reflation events (red) occur across a range of ...
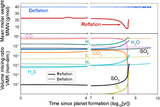
Evolution of atmospheric composition for the la...
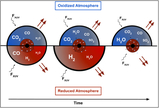
Qualitative illustration of the reflation mecha...
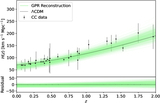
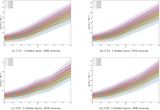
The reconstruction of H(z) from the CC dataset ...
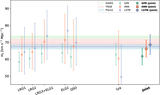
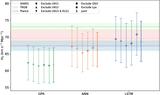
Posterior distributions of the Hubble constant ...
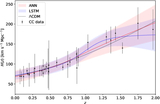
The reconstruction of H(z) from the CC dataset ...
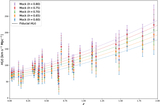
The simulated CC datasets. The dashed lines rep...
The ANN reconstruction results applied to the m...
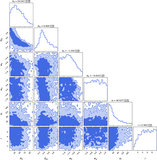
The 1D and 2D marginalized posterior distributi...
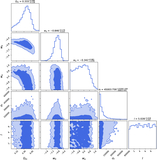
The 1D and 2D marginalized posterior distributi...
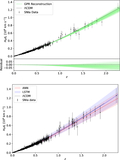
The nonparametric reconstruction of H0dL(z) fro...
Impact of the individual DESI BAO data point on...
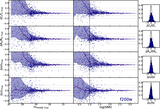
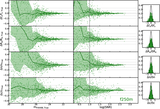
Example Sérsic fits of two galaxies in all 20 N...
Recovery tests in F444W: the Sérsic parameter f...
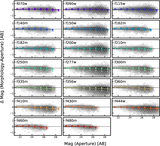
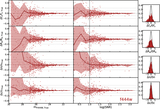
The difference in magnitude from this work (str...
The left panel shows the redshift versus stella...
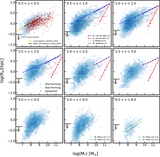
The distribution in mass versus rest-frame opti...
Nine examples at z ∼ 0.3−8 whose observed sizes...
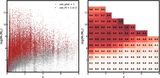
The gray histogram shows the distribution of th...
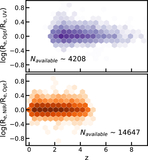
The left panel shows the median difference betw...
A recovery test in F200W: the plotting conventi...
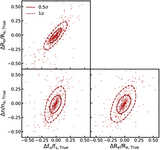
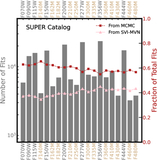
The corner plot showing the scatter of fraction...
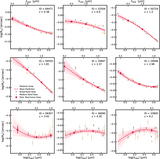
In the top panel, we show the rest UV-optical c...
ANNOUNCEMENTS
Take the AstroExplorer for a spin!
Be sure to try the search and sorting features, which were added based on user feedback; browse and find the links to videos and interactive figures in our Journal articles; find AAS Research Notes; or notice that new publishers have begun adding their figures to the AIE. Get in touch to hear more!