Latest Images
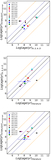
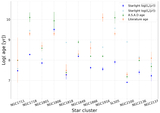
Correlation between A.S.A.D and STARLIGHT age v...

The observed and reddening-corrected (with E(B ...
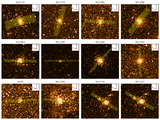
DSS images for the star clusters sample (6...
Correlation between A.S.A.D and STARLIGHT age v...
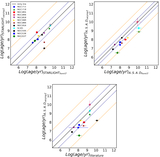
Comparison between A.S.A.D and STARLIGHT age va...
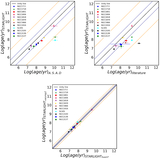
Correlation between A.S.A.D and STARLIGHT age v...
Normalized reddening-corrected spectrum using A...
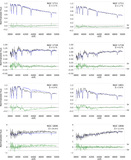
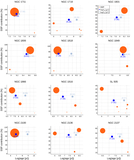
Surface plots of age reddening for each star cl...
Surface plots of age reddening for each star cl...
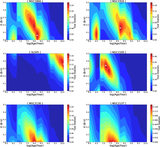
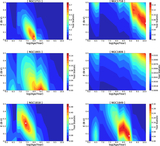
SSP contributions for each star cluster from th...
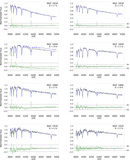
Continued from Figure 10.
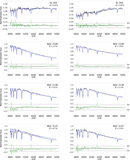
Continued from Figure 10.
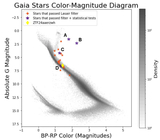
Color–magnitude diagram from 2024 November 25, ...

Light curve for ZTF24aaerzwh. This source was c...
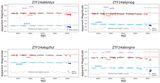
Light curves are plotted for all four objects t...
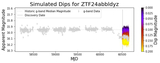
Simulated dips of varying amplitudes are plotte...
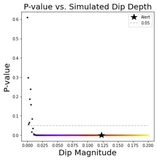
p-value from the two-sample K-S test is plotted...
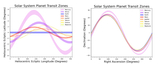
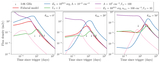
Transit zones for all solar system planets are ...

MOC map for the Mercury transit zone is plotted...
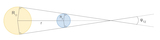
Transit zone angle geometry. The yellow and blu...
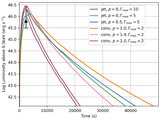
X-ray luminosities as a function of time from t...
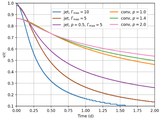
Model photospheric velocity of the shock breako...
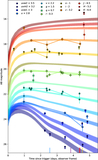
The UVOIR light curve of SN 2025kg’s fast cooli...
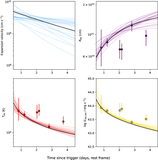
The velocity, radius, temperature, and luminosi...
ANNOUNCEMENTS
Take the AstroExplorer for a spin!
Be sure to try the search and sorting features, which were added based on user feedback; browse and find the links to videos and interactive figures in our Journal articles; find AAS Research Notes; or notice that new publishers have begun adding their figures to the AIE. Get in touch to hear more!