Latest Images
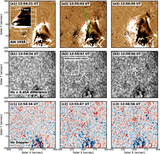
Evolution of the coronal EUV wave and the assoc...
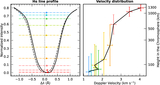
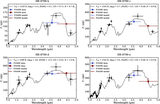
Left panel: normalized Hα spectral profile of t...
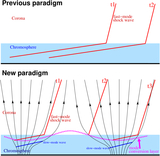
Schematic sketch comparing the traditional unde...
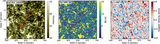
Spatial relationship between the Moreton wave f...
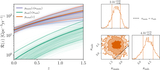
The inferred merger rate evolution with redshif...
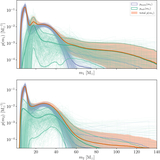
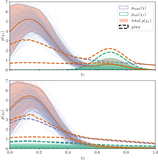
Inferred primary (top panel) and secondary (bot...
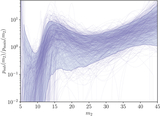
Ratio of the subpopulation’s 1G mass distributi...
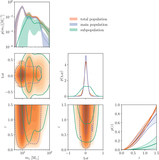
Population-level correlations caused by hierarc...
Mass ratio distributions, marginalized over hyp...
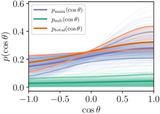
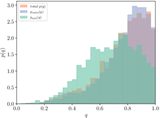
Distribution of spin orientations for the main ...
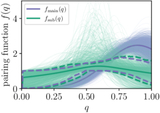
Inferred pairing functions for the subpopulatio...
Distributions of spin magnitudes. The main popu...
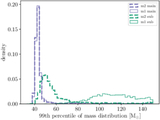
99th percentile of the primary (solid) and seco...
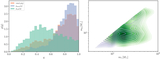
Mass ratio (left panel) and two-dimensional mas...
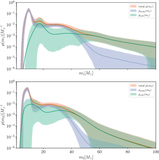
Marginal primary (top) and secondary (bottom) m...
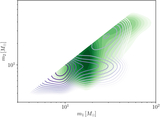
Two-dimensional mass distributions of the main ...
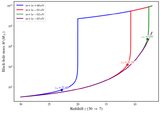
Mass evolution of a 10 M⊙ seeding black hole fr...
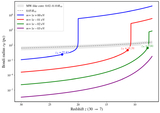
Counterpart evolution of the Bondi radius rB(z)...
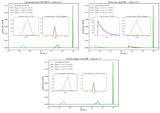
Evolution of the QCD PBH mass function for logn...
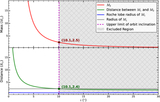
Dynamical constraints on the unseen companion. ...
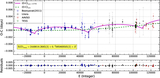
O − C diagram of BE Lyn (with the linear epheme...
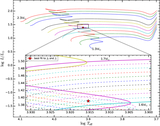
Hertzsprung–Russell diagram showing evolutionar...
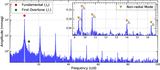
Frequency spectrum of BE Lyn. The main panel (0...
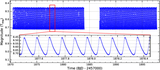
Light curve of BE Lyn from TESS Sector 21. The ...
ANNOUNCEMENTS
Take the AstroExplorer for a spin!
Be sure to try the search and sorting features, which were added based on user feedback; browse and find the links to videos and interactive figures in our Journal articles; find AAS Research Notes; or notice that new publishers have begun adding their figures to the AIE. Get in touch to hear more!