Latest Images

Approximate depth sensitivities of each measure...

Visual schematic of the Bayesian inversion proc...

Subsurface thermal inertia derived from Mars Gl...

These panels represent PDFs of the ice content ...

Each panel represents a PDF for the prior knowl...

Hydrogen abundance data from MONS within the la...

Geomorphology map identifying regions with feat...

PDFs of the composition models that satisfy fou...
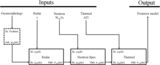
Bayesian inversion flowchart for interpreting i...

Bayesian inversion flowchart for interpreting i...

Thermal conductivity as a function of porosity,...

The lower 1σ bound on ice percentage in the nea...

The ice fraction of the maximum likelihood mode...

Two demonstrations of the Bayesian inversion me...

The upper 1σ bound on ice percentage in the nea...

Dielectric permittivity of the Martian near sub...

SHARAD track coverage (N. E. Putzig et al. 2024...

The median ice content estimate in the near sur...

Where available, we use estimates of deeper sub...
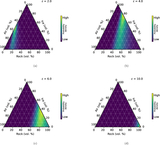
These panels represent PDFs of the ice content ...

The probability that excess ice (more than coul...

The probability of excess ice (more than could ...

The percentage that the Bayesian algorithm incr...

The median ice content estimate in the deep sub...

ANNOUNCEMENTS
Take the AstroExplorer for a spin!
Be sure to try the search and sorting features, which were added based on user feedback; browse and find the links to videos and interactive figures in our Journal articles; find AAS Research Notes; or notice that new publishers have begun adding their figures to the AIE. Get in touch to hear more!