Latest Images
Examples of interesting objects found by the SN...
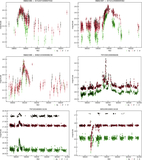
Same as in Figure 3, but for NGC 1566, NGC 2617...
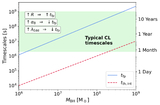
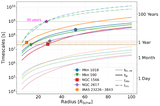
Integrated thermal timescale tth,int (red dashe...
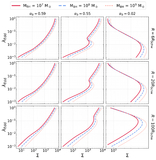
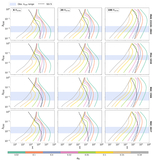
Parametric grid of S-curves in the λEdd–Σ plane...
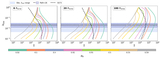
Theoretical S-curves at the λEdd–Σ plane, at th...
Vertically integrated thermal timescales tth,in...
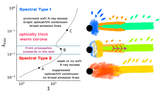
The accretion states of a CLAGN across the magn...
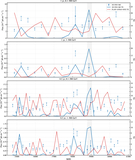
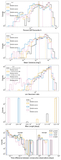
Fermi-LAT light curves of 1H 1934–063 obtained ...
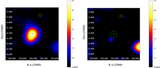
TS map (left) and residual map (right) in the 1...
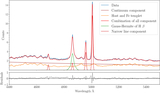
Spectral decomposition of the 6dFGS Hβ–[O III] ...
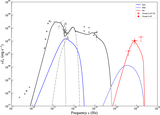
Nonsimultaneous broadband spectral energy distr...
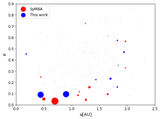
Semimajor axis–eccentricity distributions of th...
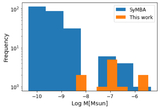
Body mass distributions at the end of the two s...
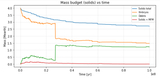
Evolution of the solid mass budget over time in...
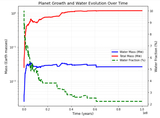
The time evolution of the water and total masse...
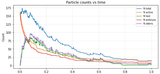
Time evolution of the number of particles in th...
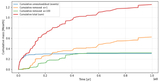
The cumulative mass removed from the simulation...
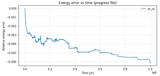
The time evolution of the nominal simulation’s ...
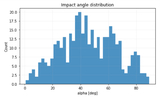
Distribution of all impact angles in our nomina...
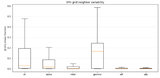
The effect a variety of variables have on the m...
The effect a variety of variables have on the m...
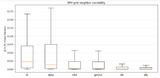
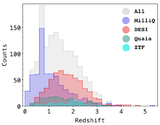
Distributions of selected light-curve propertie...
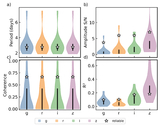
Violin diagrams of vetting metrics for AGN flag...
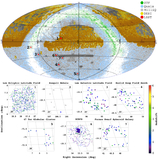
LSST DP1 sky map overplotted with the distribut...
ANNOUNCEMENTS
Take the AstroExplorer for a spin!
Be sure to try the search and sorting features, which were added based on user feedback; browse and find the links to videos and interactive figures in our Journal articles; find AAS Research Notes; or notice that new publishers have begun adding their figures to the AIE. Get in touch to hear more!